Plot distribution(s) of diagnostic metric(s)
Source:R/plot_metric_distribution.R
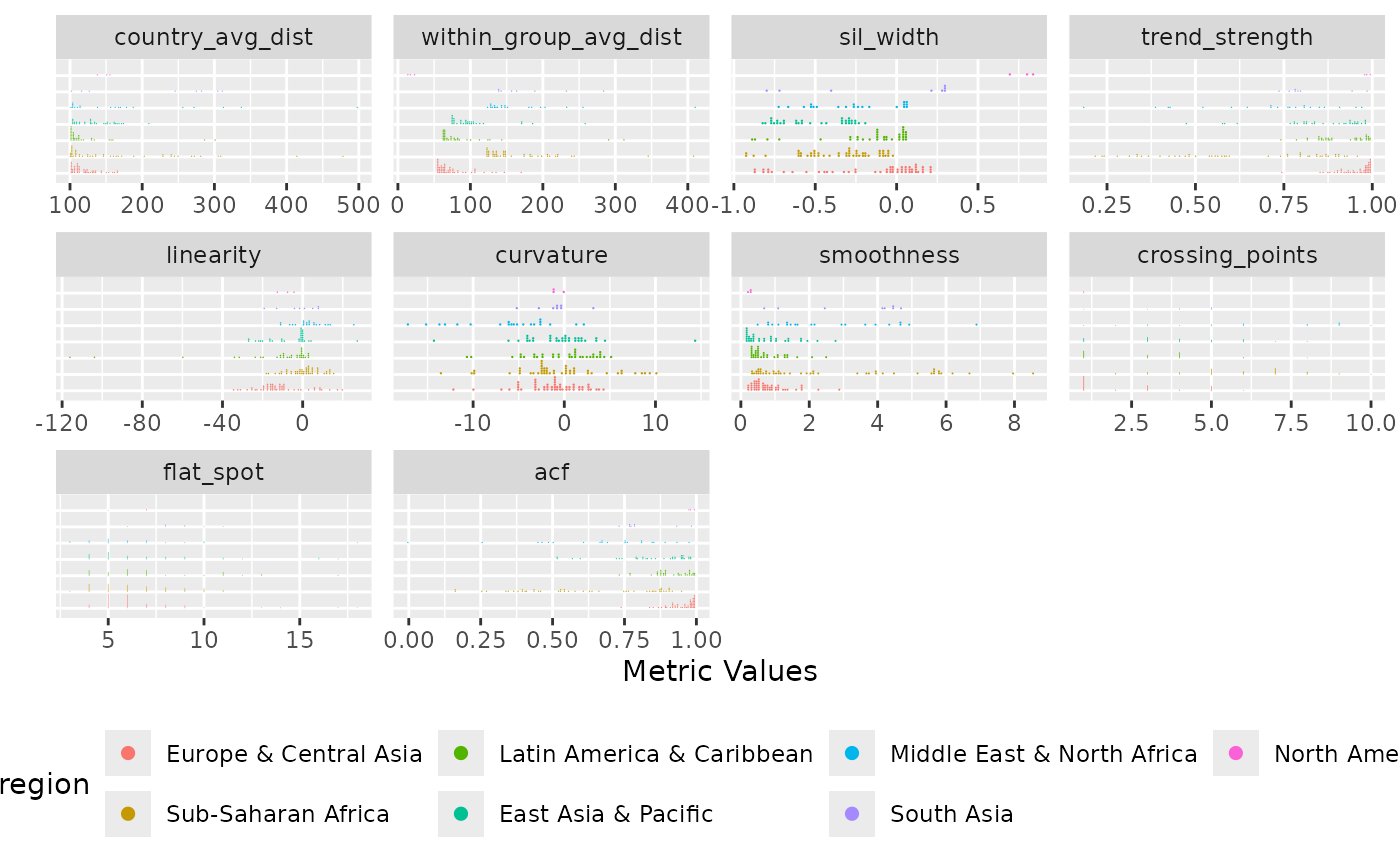
plot_metric_distribution.RdGenerates faceted ggplot displaying the distribution of either selected metric(s) or all the set of diagnostic indices.
By default, distribution(s) are ungrouped; if a group_var is specified, distributions are grouped by its levels within each panel.
If only one metric is specified in metric_var, a single panel is displayed.
Arguments
- metric_summary
A data frame containing computed diagnostic metrics and the pre-defined grouping information, generated by passing the output of any diagnostic metrics function to
add_group_info- colour_var
A variable in
metric_summarydata frame whose levels are mapped to distinct colours in the resulting plot- metric_var
Character string or vector of character strings specifying metric variable name(s) in
metric_summaryto plot IfNULL(default), distributions are plotted for all metric variables inmetric_summaryIs specified, only the distribution for the specified metric(s) will be plotted- group_var
A grouping variable in the WDI data set (e.g., "region" or "income") Default to
NULLIfNULL, distributions are ungrouped and if specified, distributions are grouped by the levels of the variable
Value
A ggplot object displaying either the ungrouped or grouped distribution of metric(s) in metric_summary.
Each metric is displayed in a separate facet panel; if one metric is specified, a single panel is shown.
Examples
pm_diagnostic_metrics <- compute_diagnostic_indices(pm_data, group_var = "region")
pm_diagnostic_metrics_group <- add_group_info(metric_summary = pm_diagnostic_metrics,pm_data)
plot_metric_distribution(pm_diagnostic_metrics_group, colour_var = "region", group_var = "region")